True property value is not found in subjective market comparisons but is revealed by calculating its « intrinsic asset floor »—a fundamental worth based on tangible components.
- A property must be deconstructed into its two core parts: the appreciating land and the depreciating building (bricks and mortar).
- Focusing on rebuild cost plus underlying land value provides a rational anchor, protecting you from market froth during peaks and highlighting bargains during troughs.
Recommendation: Use a RICS Red Book valuation to understand the asset’s lender-approved worth and conduct your own component analysis to make truly informed investment decisions.
You invite three estate agents to value your home. The first suggests £350,000, the second confidently proposes £450,000, and the third settles on a « realistic » £400,000. This common scenario leaves most homeowners bewildered, questioning which figure reflects reality. The standard advice involves analysing recent sales, decluttering the interior, and perhaps tidying the garden. This approach, however, barely scratches the surface and relies entirely on market sentiment—what other people have recently paid for similar properties.
But what if all three agents are missing the most fundamental point? What if the true, defensible value of your property isn’t determined by the colour of the walls or the style of the kitchen, but by the physical asset itself? The real question isn’t « what is the market like? » but « what is my property fundamentally worth? ». This perspective requires a shift from a market-follower to a fundamentals analyst, a mindset crucial for any sophisticated investor.
The key is to ignore the noise of comparable sales and instead deconstruct the property into its two essential, and often opposing, components: the land it sits on, an asset whose value tends to appreciate over time, and the building constructed upon it, an asset that technically depreciates. This approach uncovers the intrinsic value, or the « asset value floor, » a baseline figure that market fluctuations cannot easily erode.
This guide will dissect this analytical method. We will explore how to separate land from building value, calculate replacement costs accurately, and understand why some expensive home improvements fail to add equivalent value. By mastering this component-based view, you can finally understand why your property might be worth significantly more—or less—than comparable sales suggest.
To navigate this fundamental approach to valuation, this article breaks down the core components and strategic considerations. The following sections provide a clear roadmap for assessing your property’s true intrinsic worth.
Summary: A Fundamental Guide to Deconstructing Property Value
- Why Does the Land Under Your House Represent 70% of Total Value in Prime Locations?
- How to Estimate What It Would Cost to Rebuild Your Property from Scratch?
- Replacement Cost or Rental Capitalisation: Which Valuation Method Reveals True Worth?
- The £200,000 Garden Worth More as a Building Plot Than as Amenity Space
- When to Focus on Underlying Asset Value: During Market Peaks or Troughs?
- RICS Red Book Valuation or Estate Agent Opinion: Which Should You Trust for Remortgage?
- The £150,000 Extension That Only Added £80,000 to Property Value Because of Street Price Ceiling
- Why Did 3 Estate Agents Value Your Property £100,000 Apart?
Why Does the Land Under Your House Represent 70% of Total Value in Prime Locations?
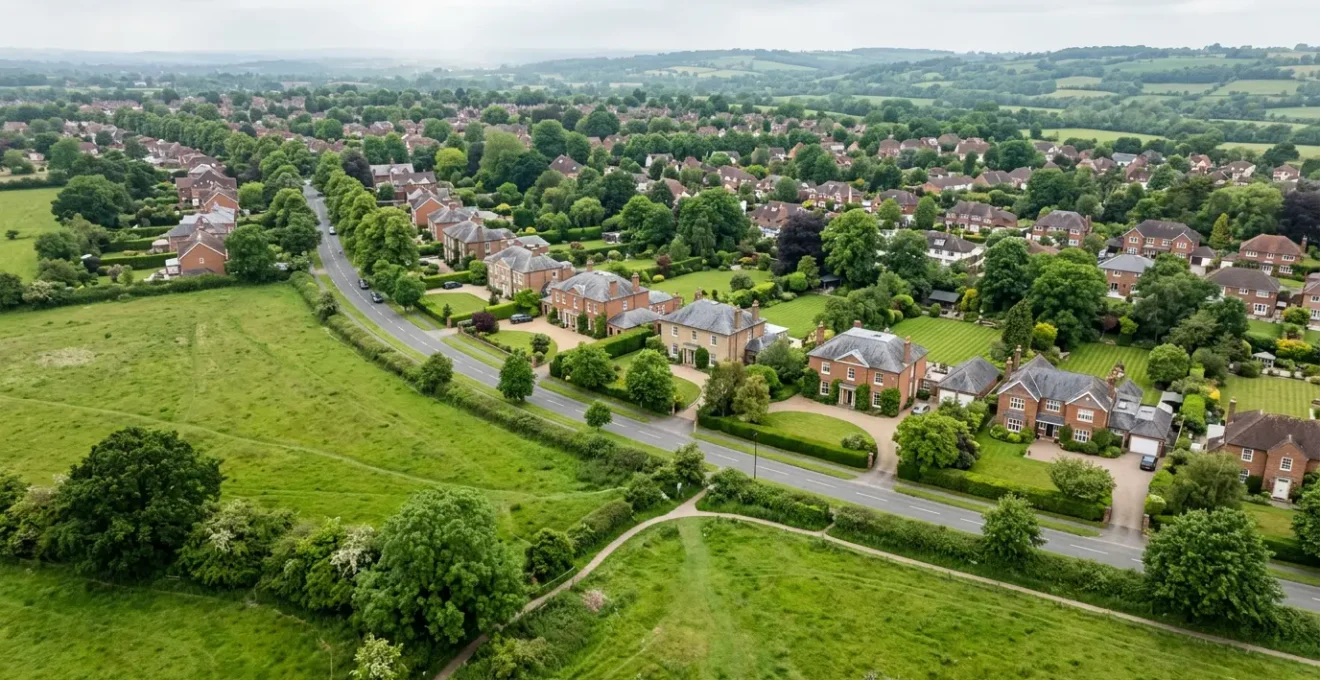
The adage « location, location, location » is a simplified way of expressing a fundamental valuation principle: you are primarily paying for the land, not the house. In high-demand areas across England, the physical structure is often a secondary component of the total price. The land itself, a finite resource in a densely populated country, is the main driver of value. This is because land is not just a patch of grass; it represents a legal right to occupy a specific point on the map, with all the associated benefits of proximity to transport, schools, employment, and amenities.
The sheer scale of this is staggering. The Office for National Statistics has calculated that land accounts for the majority of the UK’s total net worth. An ONS blog post reveals that land represents nearly three-fifths of UK net worth at £6.3 trillion. This value is amplified by strict planning regulations. For instance, with Green Belt policies severely restricting new development on vast swathes of the country, the value of land with permission to build, or land within existing residential zones, is subject to immense upward pressure.
In prime London boroughs or desirable southern commuter towns, it’s not uncommon for the land to represent 70% or even more of a property’s total market price. An investor who understands this can see through market noise. They recognise that while a house can be rebuilt or renovated, the plot of land it occupies is irreplaceable. This land leverage is the core reason why two identical houses can have vastly different values just a few miles apart—it is the underlying land, not the bricks and mortar, that commands the premium.
How to Estimate What It Would Cost to Rebuild Your Property from Scratch?
Once you isolate the value of the land, the second component to analyse is the building itself. The most objective way to value the physical structure is to determine its replacement cost, also known as the rebuild cost. This is not the market value; it’s the sum required to demolish the existing structure, clear the site, and build an equivalent property from the ground up at today’s prices for materials and labour. This figure is crucial for buildings insurance but is also a cornerstone of intrinsic value assessment for an investor.
Calculating this is a technical exercise, but accessible tools exist. The Association of British Insurers (ABI) and the Building Cost Information Service (BCIS) provide a publicly available calculator that is widely recognised as the industry standard for residential properties. Using it provides a robust, evidence-based estimate of your property’s rebuild cost, stripping away any emotional or market-driven price inflation.

To conduct this analysis yourself, a systematic approach is necessary. Following the official process ensures you account for all key variables, from property type to professional fees. The goal is to arrive at a total figure that represents the true cost of reinstating the physical asset. A simplified guide to using the recognised industry tool involves these key actions:
- Measure the gross external floor area (GEA) for all floors of your property.
- Use the free ABI/BCIS Residential Rebuilding Cost Calculator online.
- Input your property’s details: type, age, postcode, and GEA.
- The calculator will provide a base rebuild cost, including demolition, site clearance, professional fees, and party wall costs.
- Account for additional « hidden » costs not in the base figure: planning application fees, building control inspections, and potential Community Infrastructure Levy (CIL) charges from your local authority.
- Consider VAT implications, which vary depending on whether it’s a complete new build (often zero-rated) or a conversion project.
Replacement Cost or Rental Capitalisation: Which Valuation Method Reveals True Worth?
For an investor, understanding the « asset value floor » (land value + rebuild cost) is only part of the equation. Another powerful valuation tool is rental capitalisation, which values a property based on the income it can generate. This method treats the property purely as a financial asset. The calculation is simple: Annual Rental Income ÷ Capitalisation Rate (or Yield) = Property Value. For example, a property generating £20,000 in annual rent with an expected yield of 5% would be valued at £400,000 (£20,000 / 0.05).
These two methods—replacement cost and rental capitalisation—reveal different truths about a property’s worth and are best used in different contexts. The replacement cost method provides a long-term, stable measure of intrinsic value, independent of market sentiment. It is particularly useful for unique or historic properties where comparable sales are scarce. Conversely, rental capitalisation is highly sensitive to current market conditions, reflecting investor demand, interest rates, and local rental market health. It excels in high-demand rental zones like university cities or urban centres.
A sophisticated investor uses both. The replacement cost provides the rational floor—the price below which it would be cheaper to buy the plot and build the house from scratch. The rental capitalisation value indicates its current performance as an income-producing asset. When the market price falls below the replacement cost, it signals a potential bargain. When it soars far above what rental yields can justify, it signals market froth.
This comparative analysis is a core part of professional property assessment, as detailed in a guide on buy-to-let metrics. Understanding which lens to apply is key to a sound investment strategy.
| Factor | Replacement Cost Method | Rental Capitalisation Method |
|---|---|---|
| Best suited for | Unique, character-filled properties (e.g., Cornish cottages, listed buildings) | High-demand rental zones (university cities like Nottingham, Bristol) |
| Primary focus | Physical asset value (land + rebuild cost) | Income generation potential and investor returns |
| Calculation basis | Current construction costs + land value | Annual rental income ÷ capitalisation rate (yield) |
| Market conditions | Provides ‘floor value’ during market troughs | Reflects current investor sentiment and rental demand |
| England typical yields | N/A – cost-based | 5-8% (5% London, 7-8% Northern England) |
| Key advantage | Independent of emotional market pricing | Reveals investment viability and cash flow potential |
The £200,000 Garden Worth More as a Building Plot Than as Amenity Space
Nothing illustrates the principle of underlying land value better than the « hidden » potential of a large garden. To a homeowner, a spacious garden is an amenity—a place for recreation, valued for its aesthetic appeal. To a savvy investor or developer, that same piece of land could be a separate building plot, potentially worth hundreds of thousands of pounds. This discrepancy between amenity value and development value is a pure expression of land’s intrinsic worth being unlocked.
In many parts of England, particularly in towns and suburbs with good infrastructure, the value of a single building plot can far exceed the premium a larger garden adds to the existing house. For example, a house might be worth £500,000 with a large garden, but if that garden could be legally severed and sold as a plot with planning permission for £200,000, the total value of the deconstructed assets becomes £700,000 (minus the value of the now smaller-gardened house). This potential is a powerful driver of off-market sales and a key metric for investors assessing a property’s true ceiling value.
Realising this value is a complex process involving planning policy, legal access rights, and tax considerations. However, the potential returns are significant, especially given historical trends. A 2025 land market analysis highlighted a +229% increase over 20 years in UK land prices, showcasing its power as an appreciating asset. Before proceeding, a thorough assessment is crucial:
- Check the Local Plan: Verify your garden’s land designation (e.g., residential, Green Belt) on the local planning authority’s online portal.
- Assess Legal Access: Determine if a new plot would have its own independent access to a public road.
- Seek Pre-application Advice: Obtain a written opinion from the council on development viability before committing to a full planning application.
- Sever the Title: Instruct a solicitor to create a separate, saleable plot with HM Land Registry.
- Establish Utility Rights: Ensure the new plot has legal easements for water, drainage, and electricity over the retained land.
- Consult a Tax Specialist: Capital Gains Tax (CGT) implications must be fully understood, as Private Residence Relief may not apply.
When to Focus on Underlying Asset Value: During Market Peaks or Troughs?
The discipline of focusing on intrinsic asset value (land + rebuild cost) is not just a theoretical exercise; it is a powerful strategic tool that performs differently depending on the market cycle. Its true utility becomes most apparent at the extremes: market peaks and troughs.
During market peaks, when prices are high and buyer sentiment is euphoric (often termed « froth »), focusing on the underlying asset value acts as a vital rational anchor. It helps an investor avoid overpaying. If the market price for a property is £500,000, but its intrinsic value is calculated at £400,000, the £100,000 difference represents pure market sentiment or « froth. » A disciplined investor would question the wisdom of paying that premium, knowing it could evaporate in a market correction. This analysis provides the confidence to walk away from an overpriced deal.
Case Study: UK Property Market Recovery Patterns Post-2008 and Post-Pandemic
Following the 2008 financial crisis, properties in prime locations with strong underlying land value recovered significantly faster than those in areas with less intrinsic demand. The pandemic years of 2020 to 2022 demonstrated similar patterns, with extraordinary house price growth driven by supply-demand imbalances. Properties with solid asset value foundations (rebuild cost + land) showed greater resilience during the 2024 market correction, when asking price growth slowed. This illustrates how focusing on underlying asset value during market peaks acts as a rational anchor to prevent overpaying, while during troughs it helps identify undervalued properties where market price has fallen below intrinsic replacement cost.
During market troughs, the strategy’s power is reversed. In a downturn, when fear dominates and prices fall, the intrinsic value calculation helps identify true bargains. A property might be on the market for £350,000 due to a forced sale or lack of buyers, but if its underlying land and rebuild cost are valued at £400,000, it represents a clear opportunity. Buying an asset for less than its physical replacement cost is a classic value investing strategy, providing a significant margin of safety. This focus on fundamentals allows an investor to act decisively while others are paralysed by fear, securing assets at a discount to their long-term, tangible worth.
RICS Red Book Valuation or Estate Agent Opinion: Which Should You Trust for Remortgage?
When seeking a remortgage, homeowners are confronted with two very different types of valuation: the market appraisal from an estate agent and the formal valuation from a RICS-chartered surveyor. Understanding the profound difference between them is crucial. An estate agent’s appraisal is a marketing tool; a RICS valuation is a legally robust assessment of worth for lending purposes.
An estate agent’s primary motivation is to win your instruction to sell the property. They have a duty of care to you, the seller, and may provide an optimistic figure to secure your business. This figure is an opinion, not a legally binding valuation, and carries limited professional liability. In contrast, a RICS Red Book valuation is commissioned by a mortgage lender. The surveyor’s duty of care is to the lender, not the homeowner. Their job is to provide a cautious, evidence-based figure that protects the lender’s security. They face full professional indemnity liability for their assessment.

For a remortgage, the RICS valuation is the only one that matters to the lender. It is often more conservative, sometimes referred to as a « 90-day sale value, » reflecting the price the property could achieve in a relatively quick, forced sale. While an agent’s higher figure might be exciting, the lender will base their loan-to-value (LTV) calculation solely on the surveyor’s report. A sophisticated homeowner uses both: the agent’s appraisal to gauge the potential ceiling value and decide if a remortgage is worthwhile, and an understanding of the RICS process to anticipate the more realistic figure the lender will likely accept.
The difference in approach and purpose is stark, as outlined in an analysis of professional building assessments. This distinction is fundamental to managing your property finances effectively.
| Aspect | RICS Red Book Valuation | Estate Agent Market Appraisal |
|---|---|---|
| Primary purpose | Legally-binding assessment for lender security | Marketing tool to win vendor instruction |
| Duty of care | To the lender who commissioned the report | To the homeowner (to secure listing) |
| Professional liability | RICS surveyor has full professional indemnity | Limited liability for opinion-based estimate |
| Valuation approach | Conservative ‘forced sale’ value focusing on asset worth | Optimistic market value to attract seller |
| Typical cost | £300-£600 for standard property | Free (commission-based service) |
| Best use for remortgage | Realistic figure lender will likely accept | Gauge maximum potential to decide if remortgage worthwhile |
| Supporting evidence | 3-5 sold and completed comparables from Land Registry | Mix of sold and ‘for sale’ properties |
| Appeal process | Formal appeals with lender/surveying firm possible | Informal discussion to adjust opinion |
The £150,000 Extension That Only Added £80,000 to Property Value Because of Street Price Ceiling
One of the most common mistakes homeowners make is assuming that the cost of an improvement will translate directly into added market value. This is often not the case, due to a powerful but invisible force: the street price ceiling. Every street has a natural, unwritten maximum value that buyers are willing to pay for a property of a certain type, regardless of its specific features. If you over-improve your home to a standard far beyond its neighbours, you risk creating an asset that is simply too expensive for its location. You cannot sell a palace on a street of terraced houses for a palace’s price.
This principle of « overdevelopment » is a critical check against exuberant renovation plans. Spending £150,000 on a luxurious extension might only add £80,000 to the sale price if the new total value pierces the street’s established ceiling. Buyers looking for a £600,000 home are typically not searching on streets where the average price is £400,000. Your property, despite its high specification, becomes an outlier that struggles to find its market.
Case Study: Street Price Ceiling Impact on Extension ROI in Sheffield
Analysis of Land Registry sold price data for 3-bedroom terraced properties on typical streets in Sheffield and Leeds reveals a definitive price ceiling phenomenon. On a representative Sheffield street where the historical maximum sale price for 3-bed terraces is £185,000, a homeowner who invested £150,000 in a luxury two-storey rear extension with high-end kitchen only achieved a sale price of £235,000 – a value gain of just £50,000. The property was appraised by a RICS surveyor as ‘overdeveloped for the street’, with the extension creating 6 bedrooms but removing off-street parking. This demonstrates how a street’s natural price ceiling limits premium value recognition regardless of improvement quality.
Before undertaking any major extension or renovation, a rigorous cost vs. value analysis is not just advisable; it’s essential to protect your investment. This audit forces you to think like a surveyor, grounding your plans in the economic reality of your immediate location.
Your Action Plan: Cost vs. Value Extension Audit
- Research Street Ceiling: Analyse HM Land Registry sold price data for your property type on your specific street over the past 3 years to find the highest price achieved.
- Calculate Value-Add Potential: Subtract your home’s current estimated value from the identified street ceiling. This is your maximum realistic value-add potential.
- Compare Costs vs. Potential: Obtain detailed quotes for your proposed extension. If the total cost exceeds the value-add potential, the project carries a high risk of negative return on investment.
- Assess Overdevelopment Risk: Ensure the extension maintains a proper balance for the local market (e.g., adequate bathrooms for the new bedroom count, retaining off-street parking if it is highly valued locally).
- Evaluate Alternatives: If the numbers don’t stack up, consider more cost-effective improvements with higher ROI (like a loft conversion under permitted development) or evaluate selling and moving to a higher-value area instead.
Key Takeaways
- A property’s true worth is its intrinsic asset value (land + rebuild cost), not just its fluctuating market price based on comparable sales.
- Land often constitutes the majority of a property’s value in prime UK locations, driven by scarcity and strict planning laws.
- Over-improving a property can lead to a negative return on investment if its final value exceeds the « street price ceiling » for its location.
Why Did 3 Estate Agents Value Your Property £100,000 Apart?
We return to our opening dilemma: the £100,000 gap between three estate agent valuations. Armed with an understanding of intrinsic value, street ceilings, and valuation motives, we can now decode their conflicting advice. The variance is rarely about the property itself; it’s about the agents’ differing strategies and motivations.
Typically, the three valuations represent three distinct archetypes. ‘The Flatterer’ provides a high valuation to win the instruction, intending to « condition » the seller down in price after a few fruitless weeks on the market. ‘The Quick Seller’ provides a low valuation to ensure a fast, easy commission with minimal marketing effort. Finally, ‘The Researcher’ provides a mid-range, evidence-based valuation grounded in actual sold and completed comparable data from the Land Registry. This agent is pricing the property to sell at true market value, not to flatter or to under-sell.
As a sophisticated homeowner or investor, your task is not to simply pick the highest or middle figure. It is to demand the evidence behind each number and conduct your own due diligence. Which agent is basing their figure on optimistic ‘asking prices’ versus solid ‘sold’ prices? Which has used genuinely comparable properties in terms of location, size, and condition? By applying this analytical scrutiny, you move from being a passive recipient of opinions to an informed decision-maker who can identify the valuation that aligns with the property’s true market position.
This process of interrogating the valuations is the final step in bridging the gap between intrinsic worth and market price, a strategy well-documented in guides for home sellers who want to maximise their returns based on hard data from sources like market-leading property portals.
| Agent Type | Valuation Strategy | Motivation | Typical Evidence Provided | Risk to Seller |
|---|---|---|---|---|
| Agent 1: ‘The Flatterer’ | High valuation (e.g., £450,000) | Win instruction with inflated price, plan to ‘condition’ seller down after 6-8 weeks on market | Selective ‘asking price’ comparables, optimistic market commentary | Property sits overpriced, time wasted, eventual price reduction damages perception |
| Agent 2: ‘The Quick Seller’ | Low valuation (e.g., £350,000) | Fast, easy sale and commission with minimal effort or marketing cost | Cherry-picked low-end sold comparables, emphasizes ‘realistic’ pricing | Seller leaves £50,000-£100,000 on table, undervalues asset |
| Agent 3: ‘The Researcher’ | Middle valuation (e.g., £400,000) | Evidence-based pricing using actual Land Registry sold comparables for credible market positioning | 3-5 specific sold and completed properties with addresses and dates | Lowest risk – represents true market value based on evidence |
To truly master your property’s value, you must adopt this analytical mindset permanently. The next time you assess a property, either for purchase, sale, or investment, begin by deconstructing it. Separate the land from the building, calculate the asset’s floor value, and only then consider the market sentiment. This approach provides the clarity and confidence to make sound financial decisions, insulated from the market’s emotional whims.